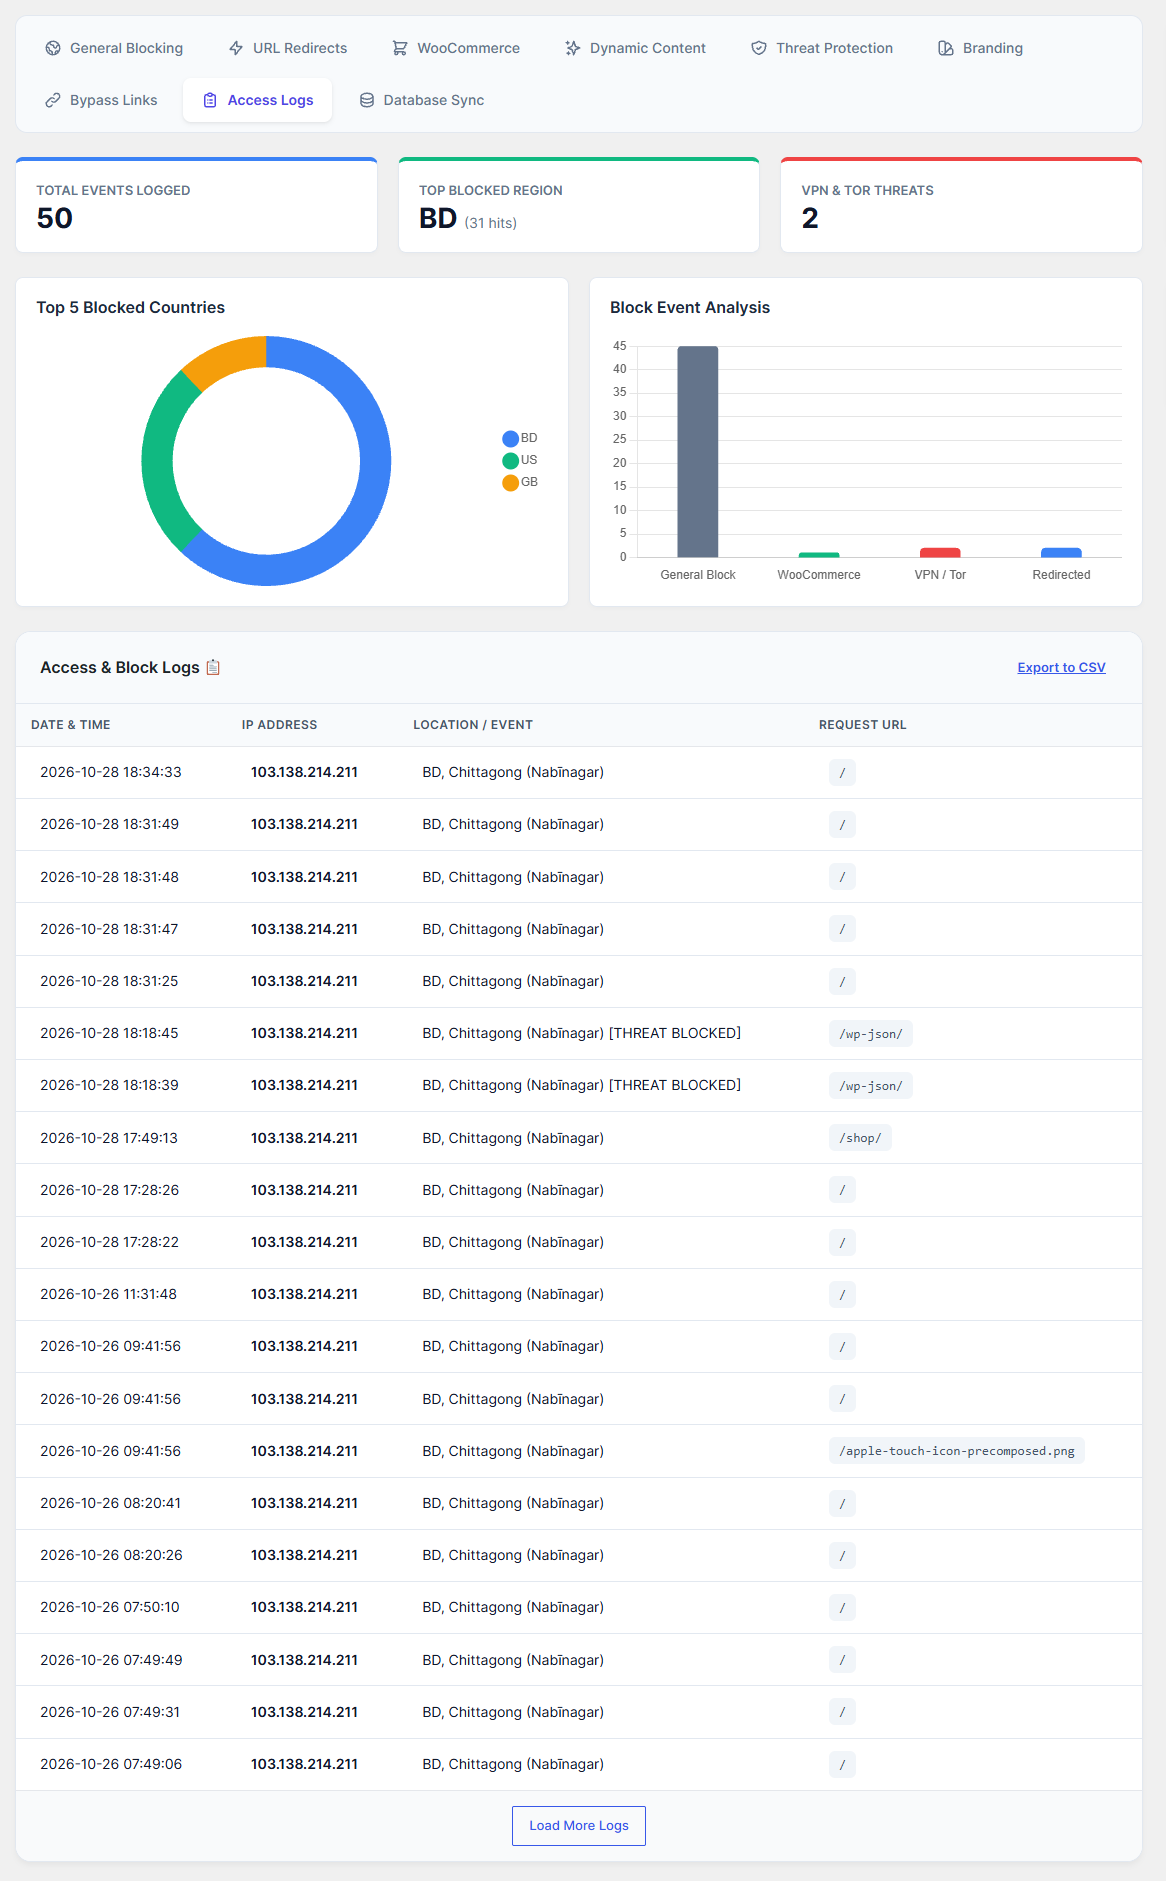
Keep track of exactly who is being blocked, where they are from, and what they were trying to access.
How to Configure:
Go to the Access Logs tab.
At the top, you will see a beautiful Visual Analytics dashboard featuring a Doughnut chart (Top 5 Blocked Countries) and a Bar chart (Block Event Analysis like VPNs vs. WooCommerce).
Below the charts is the raw data table showing Date, IP, Location, and Request URL.
Click Load More Logs to see older events.
Export Data: Need this for a security audit? Click the Export to CSV button at the top right of the table to download all records instantly.